Plugin Registration Tool


- From the plugin registration tool, click the Install Profiler.

2. Once it finished, make sure
Plugin Profiler exists.
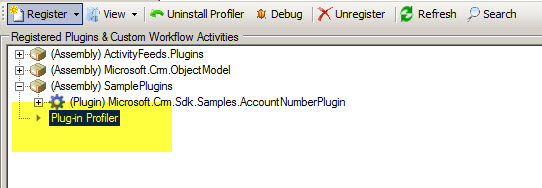
3. Select the plugin step needed to debug, click
Profiler to enable profiling.

4. In the CRM system, perform the account creation which will trigger the plugin to be execute. Download the error log file and save it.

5. Run the visual studio solution, attach debug process named "PluginRegistration".
Set a break point in the code.

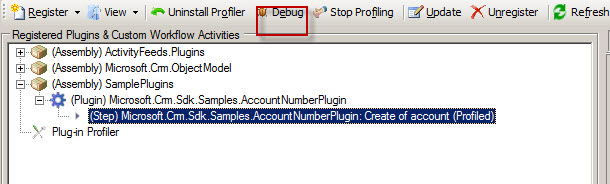
6. Open the plugin registration tool, click the Debug button

7. Browse the profile location with the erro log we downloaded .
Choose the assembly location and click start plugin execution.

8. System will auto step into visual studio breakpoint line
No comments:
Post a Comment